
Data Visualization
Transform data into visually compelling dashboards and reports
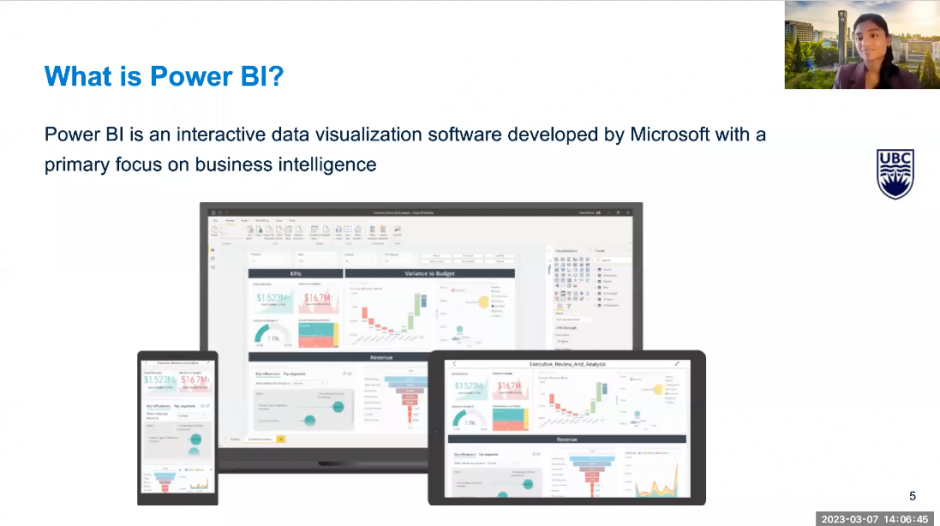
Data Visualizations with Power BI
Power BI is an interactive data visualization and analytics platform used to create dashboards and reports for research, education, and administration.
This easy-to-use platform helps you transform raw data into visually captivating, easily understood information, enabling you to quickly discover patterns in your data.
What can I use it for?
- Operational dashboards
- Interactive health dashboards
- Clinical trials administration reporting
| Login | You can access Microsoft Power BI from your computer as soon as you install the Microsoft Power BI desktop application.
To publish and share dashboards, you will need to request and access the UBC Faculty of Medicine report server. Complete set-up, and login below. |
| Request a Project | |
| Cost | Free for faculty, staff, and students associated with the Faculty of Medicine |
| Privacy | Verified by UBC’s Privacy Impact Assessment process. |
| Features |
|
Advanced Services Offered:
In progress
Previous Workshops
Introduction to Power BI
60 minutes
This introductory workshop provides an overview of Power BI, as well as a demo for creating and sharing a dashboard in Power BI.
Prerequisites:
- Install Power BI Desktop on your computer (see instructions for Windows and Mac (coming soon) users)
- Download the starter file to your computer
Training Materials
Virtual Power BI 101 Course
30 minutes

In this course, you’ll discover how Power BI transforms raw data into meaningful insights through interactive visualizations and reports. This course will guide you through the fundamentals of Power BI, including data transformation, dashboard creation, and more.
By the end of the course, you’ll be ready to build your own Power BI dashboards!
How Do I Use Power BI?
Access the UBC Power BI report server with a non-UBC computer
*This assumes you have power BI Desktop downloaded
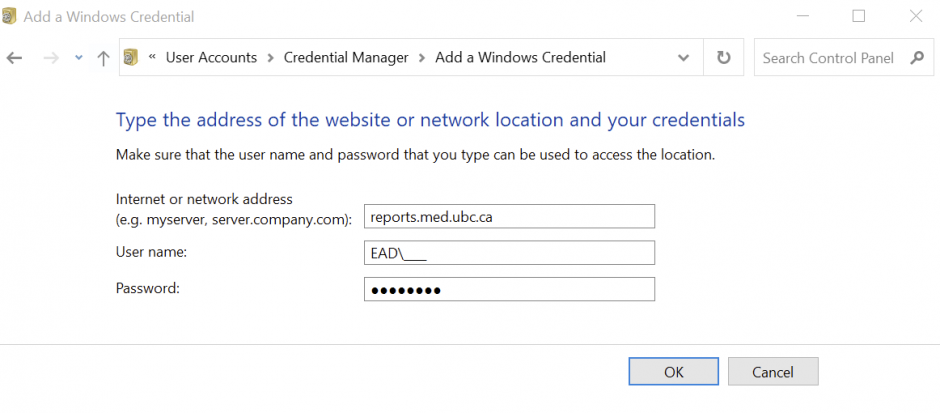
If you are using a non UBC Windows computer, you will need to add a windows credential to connect to the Power BI report server.
To do this, go to:
Control panel -> User Accounts -> Credential Manager -> Add a Windows Credential
Then type the following information
- Internet or network address: reports.med.ubc.ca
- User name: EAD\(your cwl)
- Password: your cwl password
Then refresh your report server and select ‘Edit in Power BI Desktop.' The Power BI Desktop version should open with your report server visualizations.
Where can I get more support with Power BI?
Technical Support:
- For more how-to instructions, explore Microsoft's Power BI documentation.
- Pre-made Power BI visuals are available from Microsoft through AppSource. These visuals are created by Microsoft and partners, and are validated by the AppSource team.
- Contact us for further assistance.
For PowerBI requests, please complete the Power BI request form or contact us.


